Section 5: Post-Mortem Forensics - Memory
| Course Overview | Return to Section 4 | Proceed to Section 6 |

5. Post-Mortem Forensics: Memory
5.1. Transferring the Artifacts
First thing’s first - we need to transfer the artifacts we produced in 2.3.6 over to our Ubuntu analyst VM.
But just as a note: we’ll only transfer our memory dump and packet capture. We won’t transfer our log files - I’ll explain exactly why later.
Ok so there are a number of ways we can transfer our files over, and if you have your own method you prefer please go ahead. I’m going to opt for using Python3 to quickly spin up a simple http server. For simplicity sake ensure both files (dllattack.pcap and memdump.raw) are located in the same directory, in my case they are both on the desktop.
So let’s go ahead and do it:
- First download the
Python3installer for Windows here. - Then run the installer, all default selections.
- Once it’s done open an administrative
Command Promptand navigate to the desktop. - We can now create our http server.
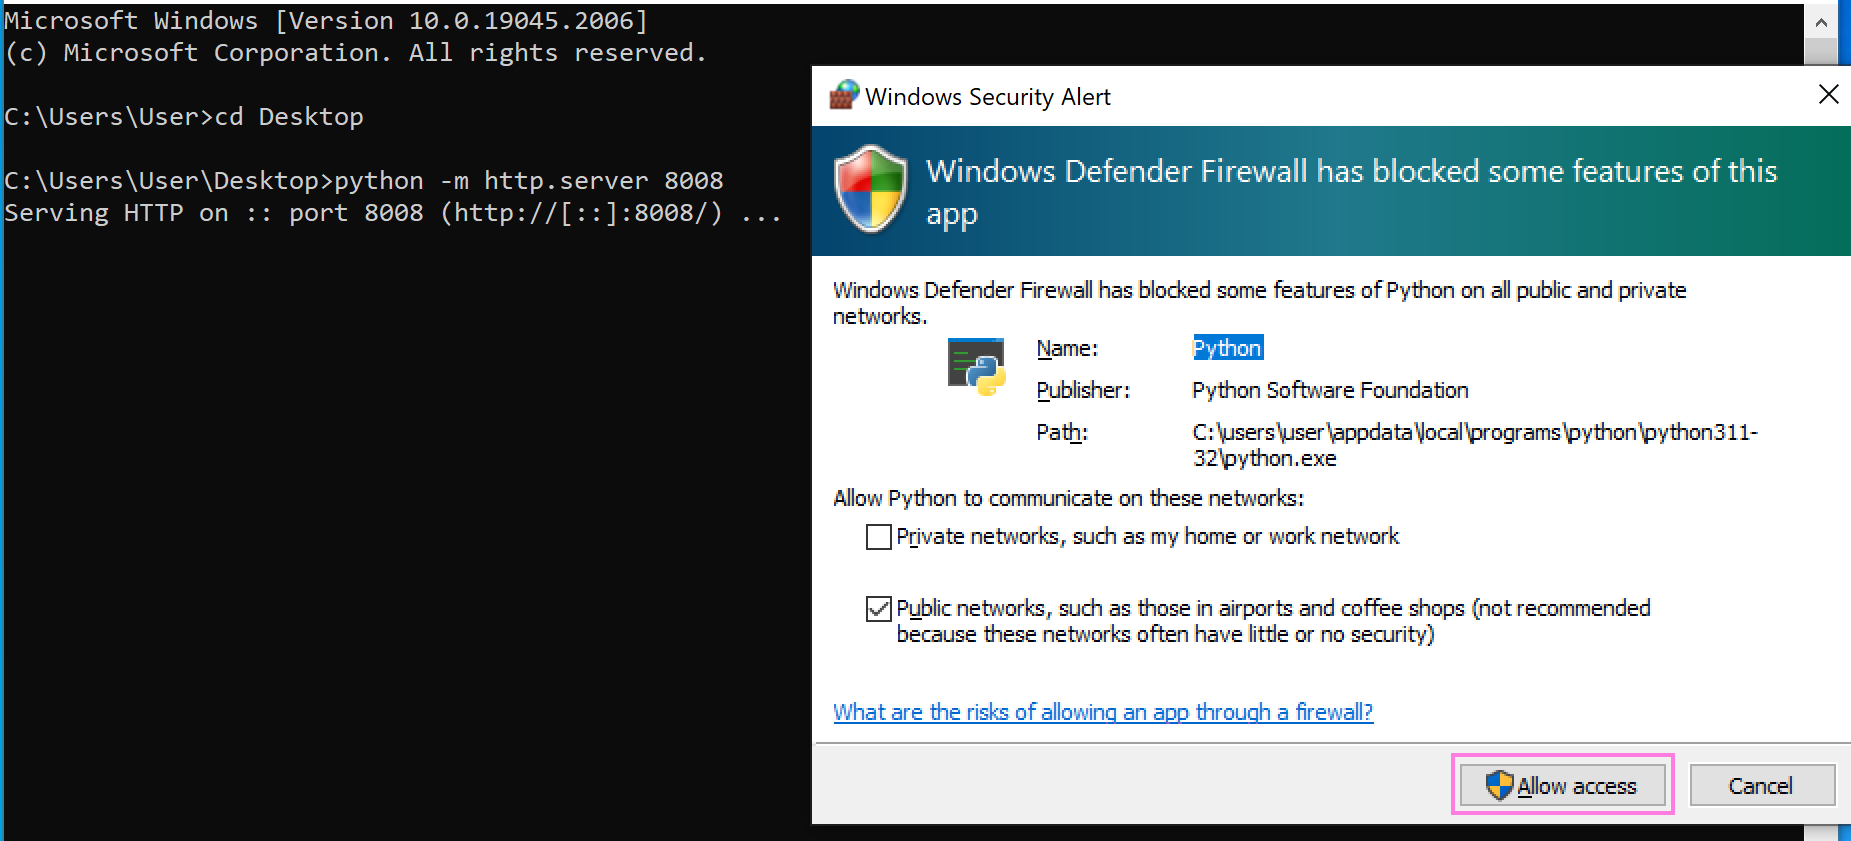
python -m http.server 8008
- You will more than likely receive a Windows Security Alert, click
Allow Access.

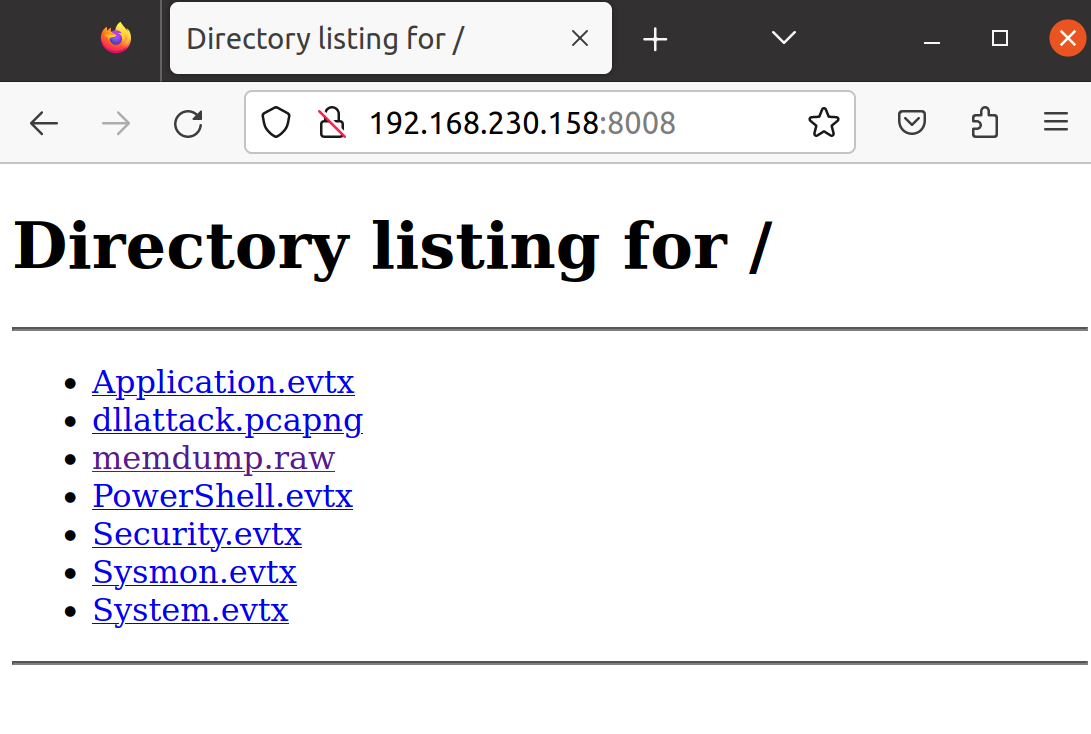
- Now head on over to your Ubuntu analyst VM and open the browser (FireFox). Navigate to
http://windows_IP:windows_port, in my case that would behttp://192.168.230.158:8008.

- Go ahead and save each of the files to wherever you want - for simplicity’s sake I will be saving them all directly to the desktop once again.
5.2. Introduction to Volatility
For our post-mortem analysis we’ll be using Volatility V3. If you’d like to know more check out its excellent documentation.
One important thing you have to know before we move ahead is that Volatility uses a modular approach. Each time you run it you have to specify a specific plug-in, which performs one specific type of analysis.
So for example here are the plug-ins we’ll use and their associated functions:
pslist,pstree, andpsinfoall provide process info.handlesshows us all the handles associated with a specific process.cmdlineshows the command prompt history.netscandisplays any network connections and sockets made by the OS.malfindlooks for inject code.

Now that you have a basic idea of the modules we’ll be using, let’s continue with our actual analysis.
5.3. Analysis
5.3.1. pslist, pstree, and psinfo
Two of the most common plugs-ins are pslist and pstree. The former gives us a list of all processes with some key details, pstree conversely will also show Parent-Child relationships. Since we’ve already seen this info multiple times now we’ll skip it here, but I wanted be aware that, if for whatever reason you were not able to perform the live analysis, you can gather all the same important process information from the memory dump using Volatility.
Let’s quickly run another module, psinfo, to break the ice and remind ourselves of the PID, which we’ll need for some of the other plugins.
- Open a terminal and navigate your your main Volatility3 directory, in my case it is
/home/analyst/Desktop/volatility3. - Let’s run our
psinfoplugin using the following command:
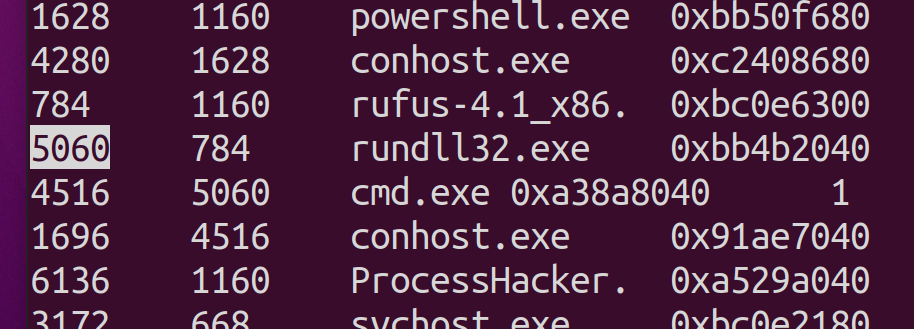
python3 vol.py -f ~/Desktop/memdump.raw windows.pslist
- Scroll down until you see
rundll32.exeand note it’s PID, you can see in my example below it’s5060, we’ll use this for our next plug-in.

5.3.2. handles
Now that we’ve got the PID of our suspicious program we’re going to look at its handles.

A handle is like a reference that a program uses to access a resource - whether that be files, registry keys, or network connections. When a process wants to access one of these resources, the OS gives it a handle, kind of like a ticket, that the process uses to read from or write to the resource.
For threat hunting it’s a great idea to look at the handles of any process you consider suspect since it will give us a lot of information about what the process is actually doing. For instance, if a process has a handle to a sensitive file or network connection that it shouldn’t have access to, it could be a sign of malicious activity. By examining the handles, we can get a clearer picture of what the suspicious process is up to, helping us to understand its purpose and potentially identify the nature of the threat.
Now to be frank this analysis of handles can be a rather complex endeavour, relying on a deep technical understanding of the subject. So I’ll show how it works, and of course provide some insight on the findings, but be aware that I won’t be able to do an exhaustive exploration of this topic as that could be a multi-hour course in and of itself.
Let’s run the windows.handles plugin with the following command, including the PID of rundll32.exe as we just learned.
python3 vol.py -f ~/Desktop/artifacts/memdump.raw windows.handles --pid 5060
We see a large number of output, too much to meaningfully process right now. However what immediately sticks out is Key - meaning registry keys. So let’s run the same command but utilize grep to only see all handles to registry keys:
python3 vol.py -f ~/Desktop/artifacts/memdump.raw windows.handles --pid 5060 | grep Key
We can see the results in the image below:

Again, as has been the case before: nothing here is inherently indicative of malware. However, in the case where we suspect something of being malware, many of these registry key handles are commonly absed by malware.
For example:
MACHINE\SOFTWARE\MICROSOFT\WINDOWS NT\CURRENTVERSION\IMAGE FILE EXECUTION OPTIONS:
This key is commonly used to debug applications in Windows. However, it is also used by some malware to intercept the execution of programs. Malware can create a debugger entry for a certain program, and then reroute its execution to a malicious program instead.
MACHINE\SYSTEM\CONTROLSET001\CONTROL\NLS\SORTING\VERSIONS: This key is related to National Language Support (NLS) and the sorting of strings in various languages. It’s uncommon for applications to directly interact with these keys. If the process is modifying this key, it may be an attempt to affect system behavior or mask its activity.
MACHINE\SYSTEM\CONTROLSET001\CONTROL\NETWORKPROVIDER\HWORDER and MACHINE\SYSTEM\CONTROLSET001\CONTROL\NETWORKPROVIDER\PROVIDERORDER: These keys are related to the order in which network providers are accessed in Windows. Modification of these keys may indicate an attempt to intercept or manipulate network connections.
5.3.3. cmdline
This is one of my favorite modules in Volatility, allowing us to extract command-line arguments of running processes from our memory dump. Here we’ll apply it only to the process of interest, but of course keep in mind that we could review the entire available history.
python3 vol.py -f ~/Desktop/artifacts/memdump.raw windows.cmdline.CmdLine --pid 5060

Here we receive the same insight as before, namely that rundll32.exe was not provided any arguments when it was invoked from the command line. I’m pointing this out once again so you are aware you can obtain this same information even if you were not able to perform a live analysis.
5.3.4. netscan
The netscan plugin will scan the memory dump looking for any network connections and sockets made by the OS.
We can run the scan using the command:
python3 vol.py -f ~/Desktop/artifacts/memdump.raw windows.netscan
REDO THIS SECTION POINT OUT SAME IP WE FOUND WITH NATIVE TOOLS
5.3.5. malfind
malfind is the quintessential plugin for, well, finding malware. The plugin will look for suspected inject code, which it determines based on header info - indeed much like we did manually during our live analysis when we look at the memory space content.
We can run it with:
python3 vol.py -f ~/Desktop/artifacts/memdump.raw windows.malfind
Below is a sample of the result, which is quite extensive:

We can see that it correctly flagged rundll32.exe. However, if we go through the entire list we can see a number of false positives:
- RuntimeBroker.exe
- SearchApp.exe
- powershell.exe
- smartscreen.exe
This is thus a good reminder that the mere appearance of a process in malfind’s output is not an unequivocal affirmation of its malicious nature.
5.4. Final Thoughts
This section was admittedly not too revelatory, but really only because we already performed live analysis. Again, if we were unable to perform live analysis and only received a memory dump, then this section showed us how we could derive a lot of the same information. Further, even if we did perform the live analysis, it might still be useful to validate the findings on a system not suspected of being compromised.
I think this serves as a good introduction to Volatility - you now have some sense of how it works, how to use it, and what are the “go to” plug-ins for threat hunting.

That being the case let’s move on to the log analysis, which is likely going to be the most substantial journey. For this we’ll once again use our Windows VM, so in case you turned it off, please turn it back on.
| Course Overview | Return to Section 4 | Proceed to Section 6 |